
Enterprise Dashboard Platform
Reckitt & BP
Global Logistics Intelligence Dashboard — Track, Adjust & Project
Overview
A unified logistics intelligence platform built jointly for Reckitt and BP — enabling global supply chain teams to monitor, adjust, and project shipment flows across 40+ countries in real time.
Reckitt (makers of Dettol, Nurofen, Durex, and Finish) and BP's supply chain divisions required a shared visibility layer across their complex, intertwined logistics operations — particularly around fuel and chemical distribution, FMCG raw material routing, and cross-border shipment compliance. The platform centralised live shipment tracking, demand forecasting, route optimisation alerts, and adjustable projection modelling into a single high-density dashboard environment, designed for logistics managers, procurement leads, and executive stakeholders across both organisations.
Role
Lead UX/UI Designer
Platform
Desktop Web App
Clients
Reckitt & BP Global Supply
Tools
Figma, FigJam, Maze, Lottie, Mapbox
Team
PM, 3 Engineers, UX Researcher, Data Analyst, Designer, BA
Impact
40+
Countries Tracked
£2.4B
Logistics Value Managed
28%
Reduction in Delays
6
Core Dashboard Modules
Dashboard
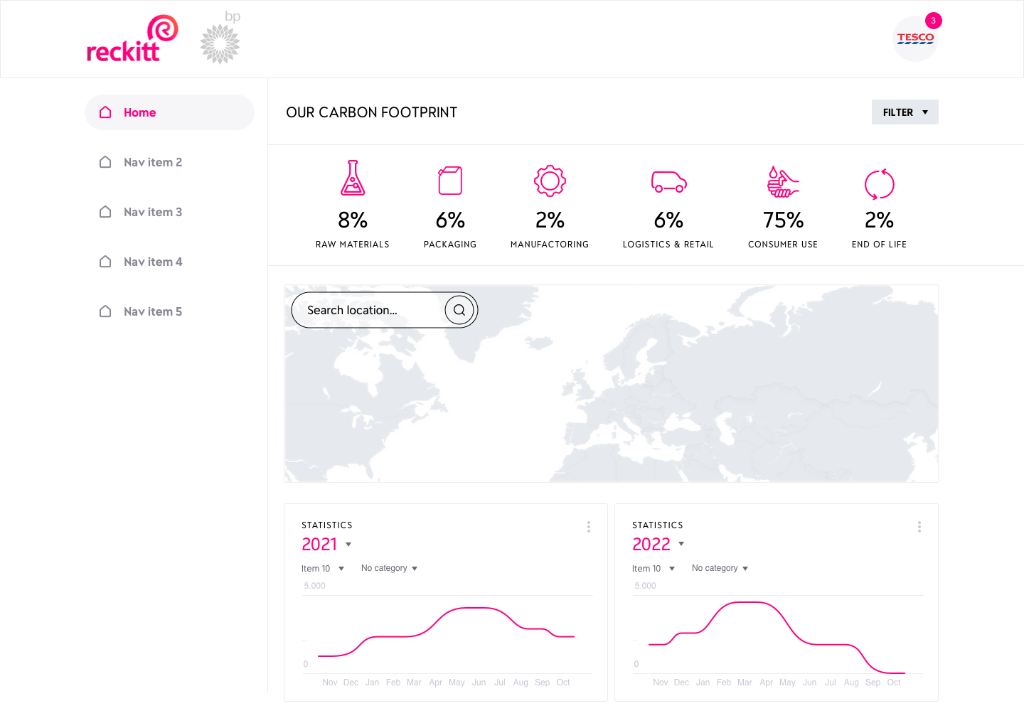
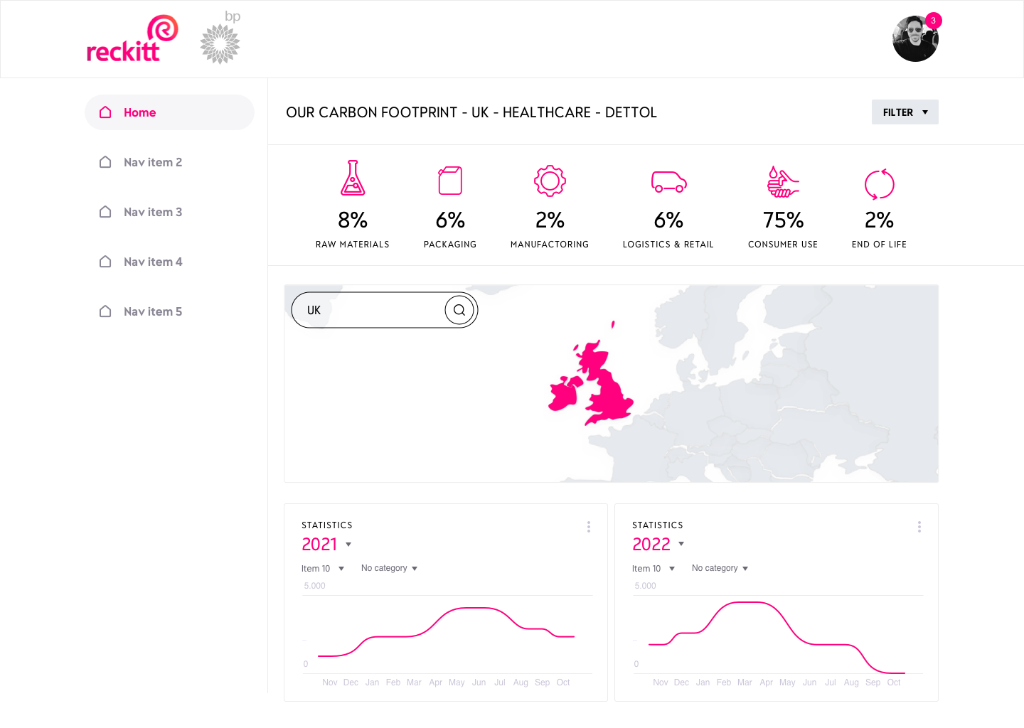
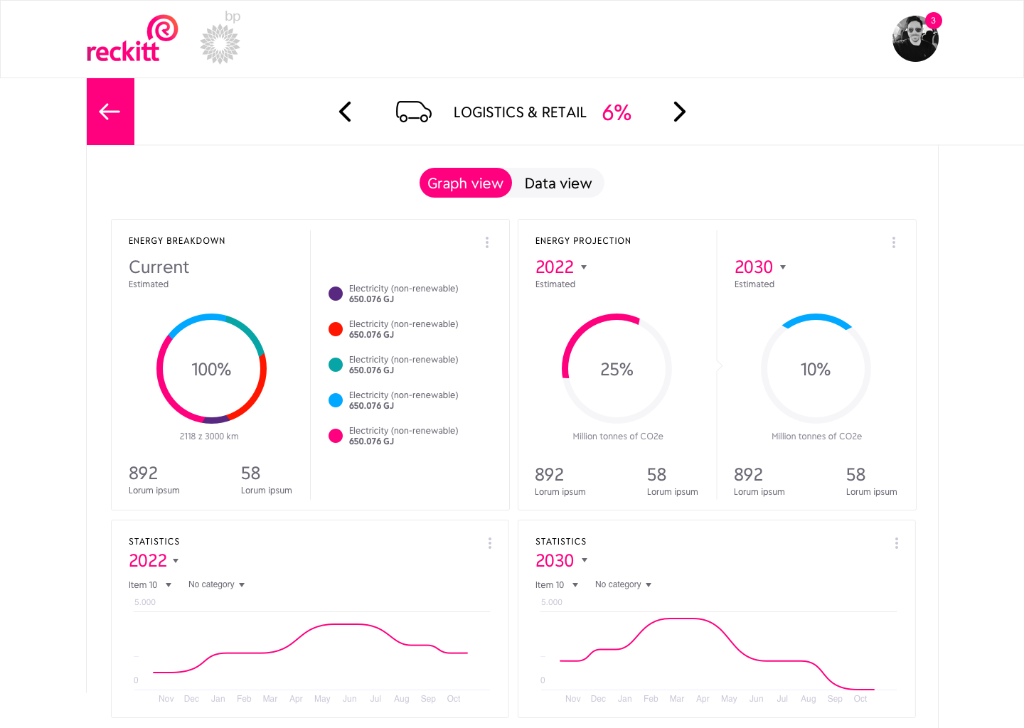
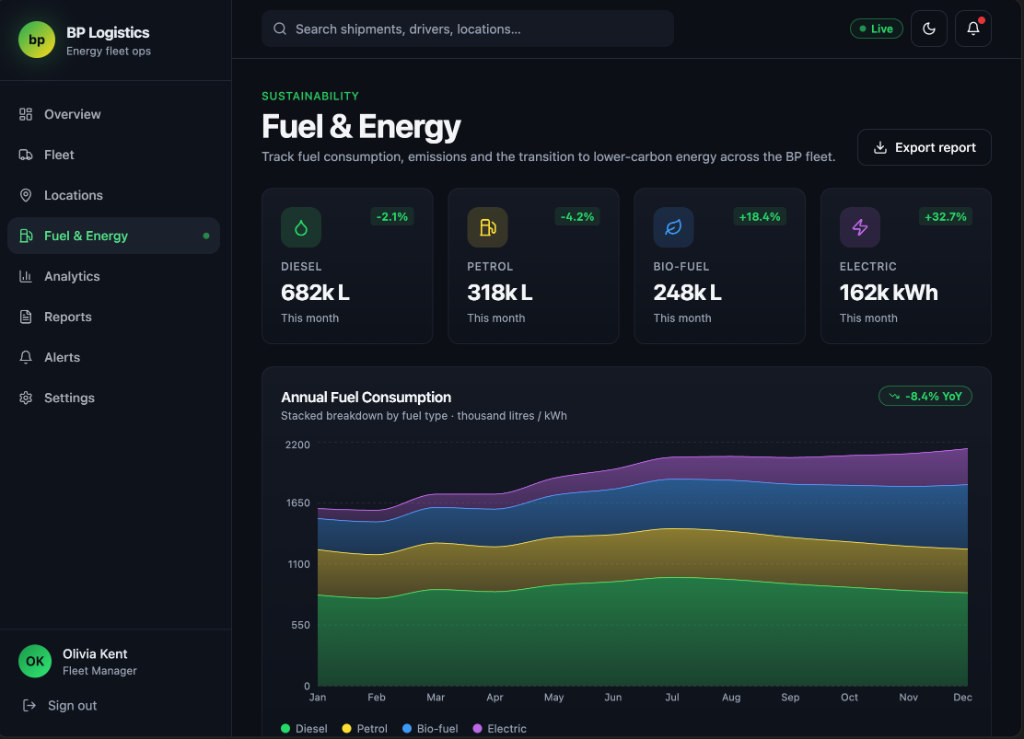
Carbon footprint tracking across the supply chain
Platform
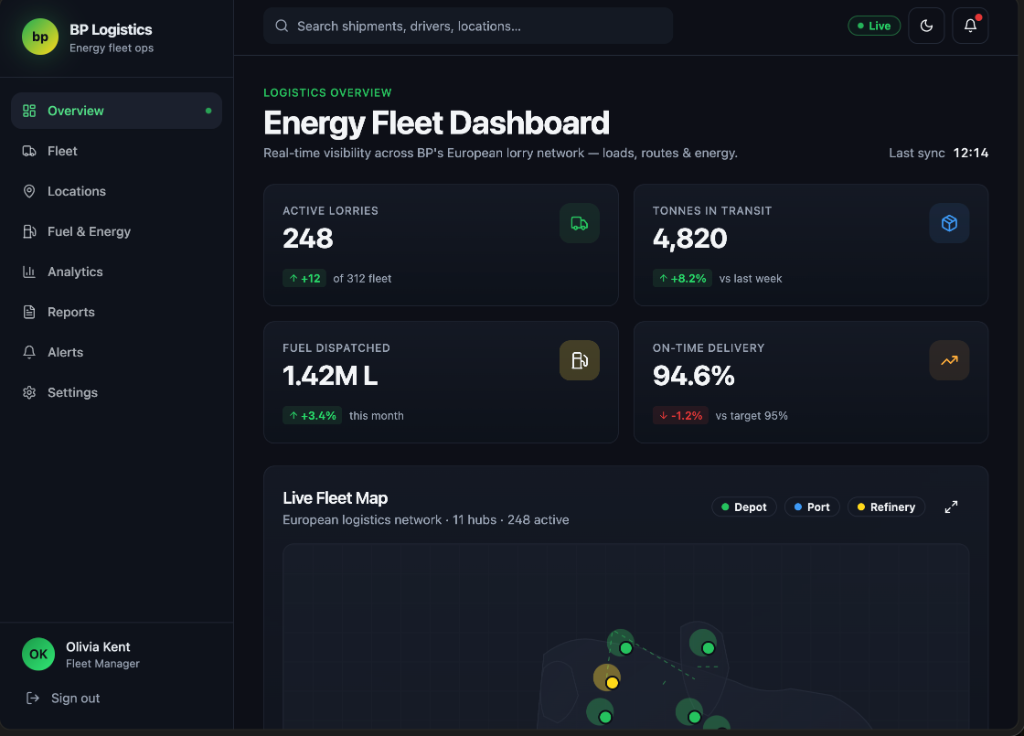
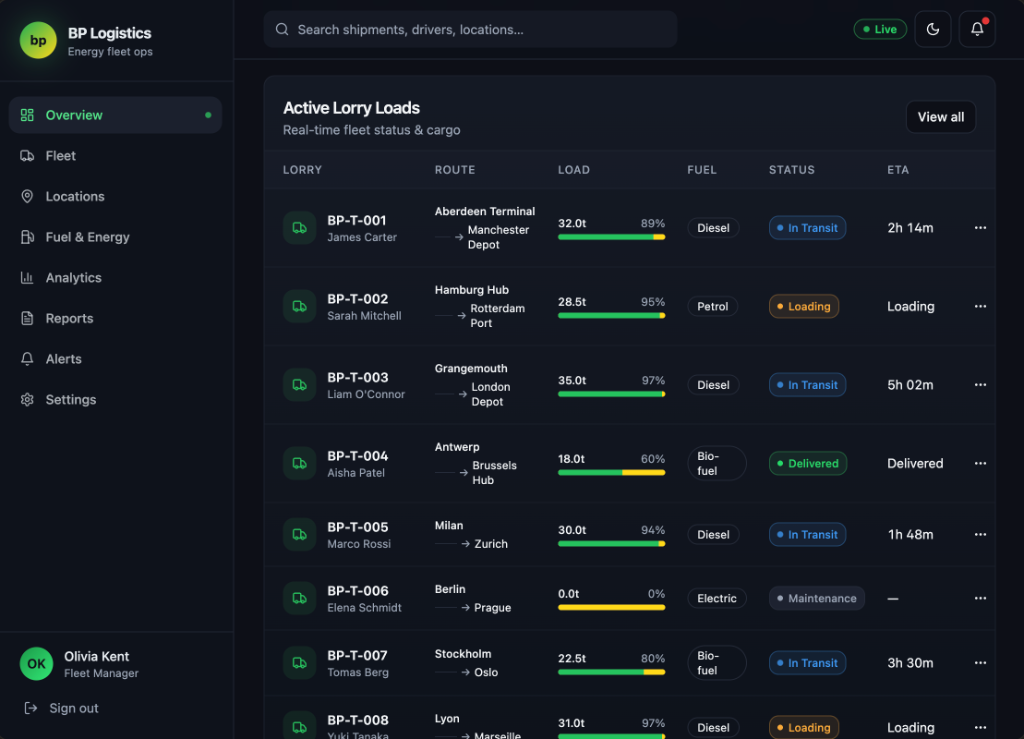
BP Logistics — Energy Fleet Dashboard
Real-time visibility across BP's European lorry network — loads, routes, fuel & energy tracking across 312 active vehicles.
Mobile
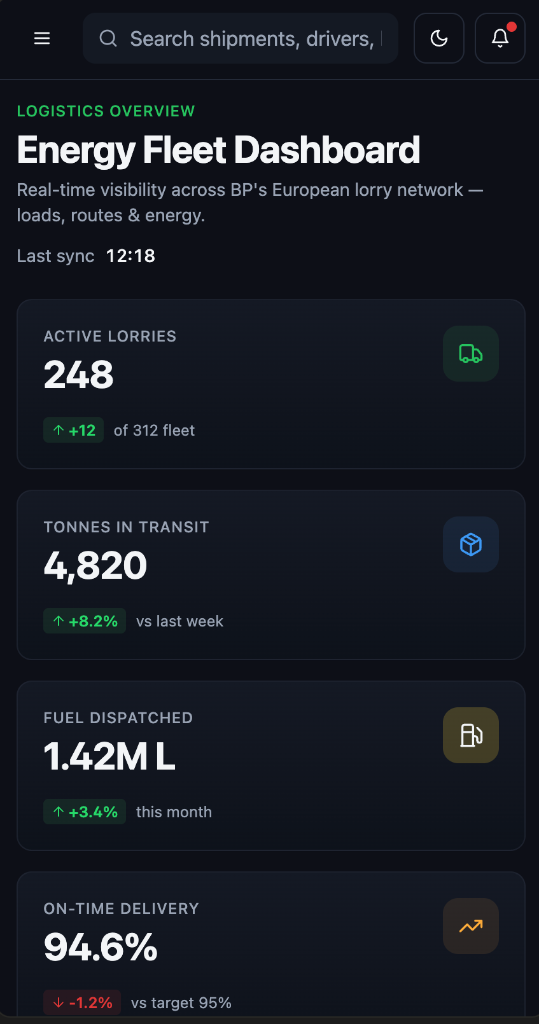
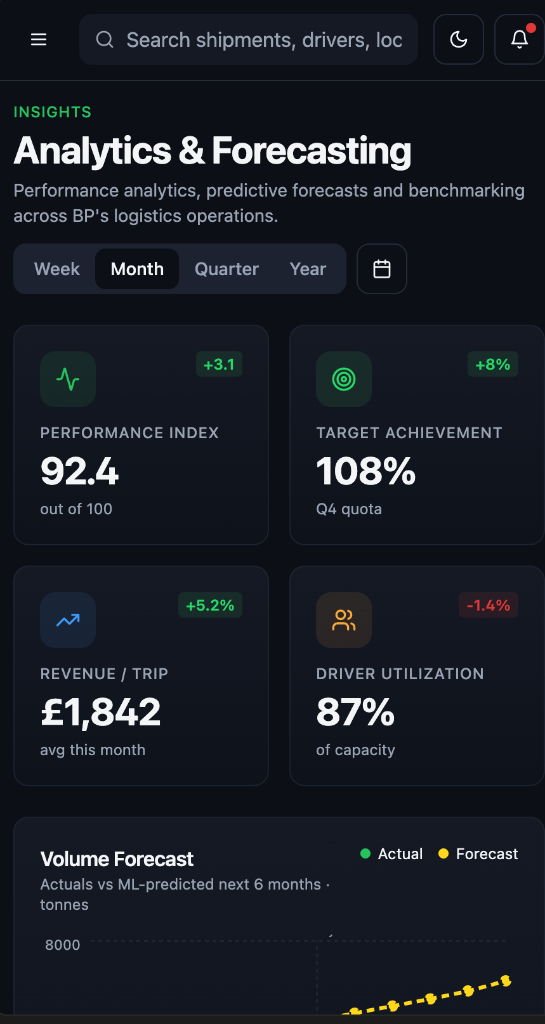
Responsive across device — full visibility on the go
01 — Discovery & Problem Space
Fragmented data, invisible delays, and zero predictive visibility
14 disconnected systems
Reckitt's procurement and logistics teams operated across 14 separate data sources — SAP, Oracle TMS, regional 3PLs, and manual spreadsheets — with no single source of truth for live shipment status.
Reactive, not predictive
Disruptions (port delays, weather, geopolitical closures) were discovered after the fact. Teams had no early warning system and no tooling to model 'what if' scenarios for alternative routing.
Executive visibility gap
Senior leadership at both Reckitt and BP had no real-time view of aggregate logistics health. Board-level reporting was assembled manually from weekly Excel exports — always 5–7 days behind.
02 — Live Shipment Tracking
Global fleet visibility on a single interactive map
The core map module renders live vessel, truck, and rail positions across all active routes. Colour-coded status rings indicate on-time, at-risk, and delayed shipments — with a side panel showing cargo manifest, ETA, carrier, and last-known checkpoint.
Live position data refreshed every 90 seconds via carrier APIs
Status rings: green (on time), amber (at risk), red (delayed >4hrs)
One-click shipment drill-down — full cargo manifest and checkpoint log
Route corridor overlays showing traffic density and congestion alerts
Filterable by region, carrier, commodity type, and SLA breach risk
Live Fleet — 216 Active Shipments
03 — Projection & Demand Forecasting
Model future states before disruption becomes crisis
EMEA Demand Forecast — Q2 2026
Dettol raw materials · 3 scenario projections
Three-scenario modelling
Optimistic, Base, and Stress scenarios are computed in real time using historical carrier performance, geopolitical risk scoring, and seasonal demand indices. Planners can adjust input variables and see projections update instantly.
Anomaly detection
Machine-learning-assisted anomaly flags surface on the forecast chart when a projected datapoint deviates beyond a configurable threshold — alerting teams to emerging bottlenecks 4–6 weeks before they materialise as delays.
Adjustable inputs panel
A side panel exposes forecast variables — demand uplift %, carrier reliability score, port congestion index, and safety stock buffer — allowing supply planners to model interventions and commit revised projections to the system.
04 — Route Adjustment & Optimisation
Reroute in seconds — not hours of manual coordination
When a disruption is flagged — a port closure, carrier capacity shortfall, or regulatory change — the Route Adjustment module suggests optimised alternatives ranked by cost, time, and carbon impact. Planners approve with a single action; the system propagates updates to all downstream systems.
AI-ranked alternative routes with cost delta and ETA comparison
Carbon impact score per route — supports Reckitt's net-zero commitments
One-click approval with automated carrier notification
Full audit trail — every adjustment logged with rationale and approver
Multi-leg recalculation for shipments crossing 3+ transit points
Route A — Current (Disrupted)
DISRUPTEDCost
£48,200
ETA Impact
+3.2 days
Carbon
142t CO₂
Route B — Via Rotterdam
RECOMMENDEDCost
£51,400
ETA Impact
+0.5 days
Carbon
138t CO₂
Route C — Air Freight
PREMIUMCost
£94,000
ETA Impact
On time
Carbon
310t CO₂
05 — Executive Dashboard
Board-level visibility in real time — not 5 days later
On-Time Delivery Rate
93.2%
+4.1%
Active Disruptions
7
-12 vs last wk
Forecast Accuracy
88.6%
+2.3%
Cost vs Budget
£2.1B
+1.4% over
Zero-effort reporting
The executive view auto-assembles KPI snapshots, regional heat maps, and trend deltas from live data — eliminating the weekly manual Excel export process that previously consumed 8+ hours of analyst time.
Drill-down by region or commodity
Any board-level metric is one click away from its underlying detail — regional on-time rates, commodity-specific cost overruns, or carrier performance rankings — giving leadership the confidence to challenge and act on data directly.
Configurable alert thresholds
Each executive user sets personal alert thresholds — email and in-platform notifications fire when KPIs breach defined limits (e.g. OTD drops below 90%), enabling proactive intervention before issues compound.
Summary
Overview
A unified logistics intelligence dashboard built for Reckitt and BP — enabling global supply chain teams to track live shipments, model demand projections, and reroute disruptions across 40+ countries.
Challenge
Both organisations operated across 14+ fragmented data sources with no predictive visibility, reactive disruption management, and board-level reporting that was always 5–7 days behind live operations.
Solution
Designed a six-module enterprise dashboard with live fleet tracking, three-scenario demand forecasting, AI-ranked route adjustment, and real-time executive KPI visibility — reducing delay resolution time by 28% and eliminating manual reporting.
Key Results
06 — User Testing
Validating with logistics managers, procurement leads, and executive stakeholders
Testing involved three distinct user groups — operational logistics managers who would use the platform daily, procurement leads who needed forecast and adjustment capabilities, and senior executives requiring rapid high-level visibility. Sessions ran across Reckitt's Slough HQ and BP's St James's Square offices.
Role-based task scenarios
Each participant group was given role-specific scenario packs — a logistics manager was asked to identify and reroute a disrupted shipment within 10 minutes; a procurement lead was asked to model a demand uplift scenario and commit a revised forecast; an executive was asked to build a board-ready KPI snapshot from the dashboard. Task completion rates and time-on-task were recorded across all groups.
Maze unmoderated flow testing
The route adjustment flow and forecast modelling panel were deployed via Maze to 24 participants across logistics and procurement roles globally. Click-path analysis revealed that the 'Adjustable Inputs' panel was consistently missed on first pass — leading to a redesign that surfaced the panel inline within the forecast chart rather than in a separate side drawer.
Cognitive walkthrough with domain experts
Subject matter experts from Reckitt's Global Supply Chain team and BP's Procurement Analytics division reviewed prototypes in structured cognitive walkthroughs — identifying domain-specific terminology gaps (e.g. 'SLA breach' was preferred over 'at risk' in shipping contexts) and data labelling inconsistencies that would have caused errors in live use.
Key Outcomes
28%
reduction in average delay resolution time — from disruption flagged to carrier rerouted
8hrs
per week saved on manual executive reporting — fully automated from live platform data
Route B
adoption pattern emerged — 91% of planners accepted the top AI-recommended route in testing
Inputs panel
redesign from side drawer to inline reduced discovery failure from 62% to 11%
"SLA breach"
terminology adopted across all status indicators after cognitive walkthrough with domain experts
Methodology
Design System
A high-density dark UI built for data-heavy enterprise use
The visual language bridges Reckitt's bold magenta identity and BP's deep blue corporate palette — unified into a shared dark dashboard aesthetic optimised for prolonged daily use by logistics professionals.
Colour Palette
Reckitt Magenta
#E0006E
Primary CTAs, Reckitt-sourced shipment indicators, alert highlights
BP Blue
#0064B4
BP-sourced data streams, navigation accents, secondary CTAs
Surface Dark
#0B0B14
Primary dashboard background across all screens
Surface 01
#14141F
Card surfaces, panel containers, sidebar backgrounds
Signal Green
#00C875
On-time status, successful route approvals, positive KPI deltas
Amber Alert
#FFB81C
At-risk shipments, approaching threshold warnings, forecast anomalies
Text Primary
#F0F0F8
Headings, metric values, KPI figures, shipment IDs
Text Secondary
#8A8AAA
Labels, table column headers, metadata, timestamps
Core Components
Shipment Status Ring
Circular indicator around each shipment node on the map — green, amber, or red — communicating delivery health at a glance without requiring the user to open the detail panel.
Forecast Chart
Multi-line projection chart with three scenario bands (Optimistic, Base, Stress), inline anomaly flags, and configurable time horizon. Scenario lines use distinct dash patterns, never colour alone.
Route Card
Comparison card listing cost, ETA impact, and carbon footprint for each suggested route alternative. Recommended option uses a primary highlight ring and a clear approval CTA.
KPI Tile
Compact stat tile for the executive dashboard — headline metric, trend delta (positive/negative colour), and a mini sparkline for 30-day context. Supports drill-down on click.
Adjustment Inputs Panel
Inline panel within the forecast chart exposing editable forecast variables — demand uplift %, carrier reliability, port congestion index. Changes propagate to the chart in real time.
Alert Banner
Full-width contextual disruption banner surfaced above the map when an active alert requires immediate attention — severity level, affected routes, and a one-click 'Review & Adjust' action.
"The platform transformed how we manage disruptions. What used to take hours of cross-team coordination now takes minutes — the route adjustment module alone has saved us significant cost and prevented several major stockout events across our EMEA network."
David Thornton
Global Supply Chain Director, Reckitt