App Design

Las Vegas — Venue Management Platform
Overview
A real-time kart racing venue management platform powering F1 Drive Las Vegas — from session scheduling to live race leaderboards.
F1 Drive needed an end-to-end operational tool for venue staff to manage a complex, high-throughput racing experience. The platform handles session scheduling, kart assignment, live race timing, driver profiles, and post-race stats — all within a single cohesive dark interface designed for fast-paced, low-light environments.
Role
Lead UX/UI Designer
Platform
Desktop Web App
Duration
8 months
Tools
Figma, FigJam, Maze
Team
PM, 3 Engineers, User Researcher
Impact
92%
Staff Efficiency Gain
4
Session Types Managed
<2s
Live Data Refresh Rate
40+
Karts Tracked per Session
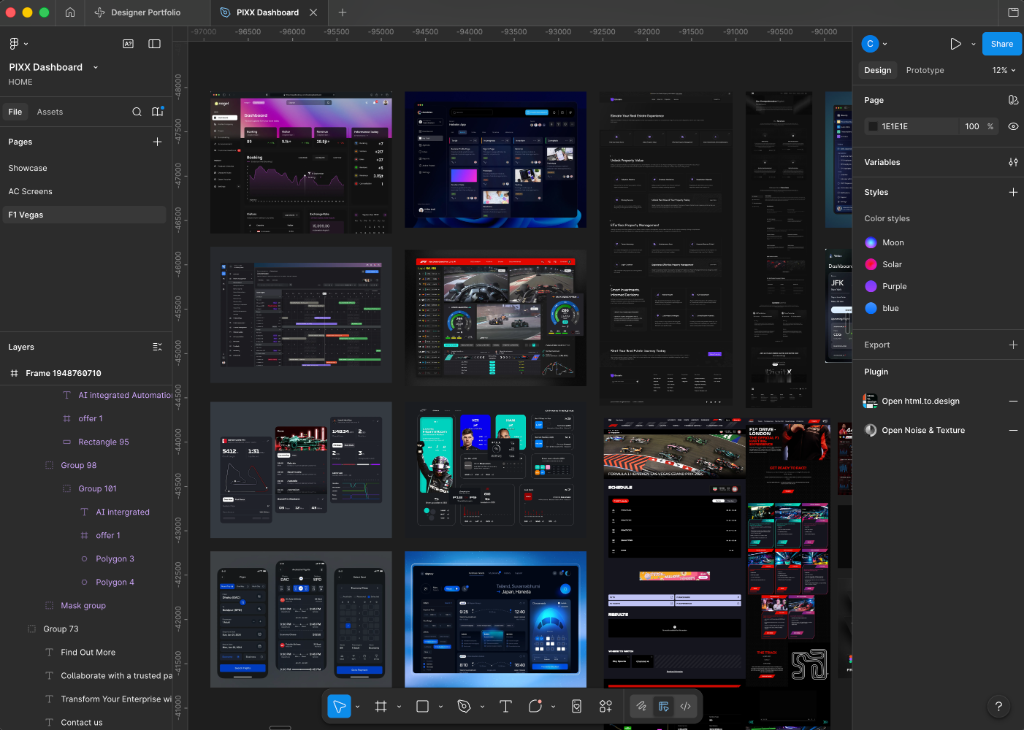
Discovery — Competitive Audit
Research and design benchmarking
Discovery — Lo-Fi Wireframes
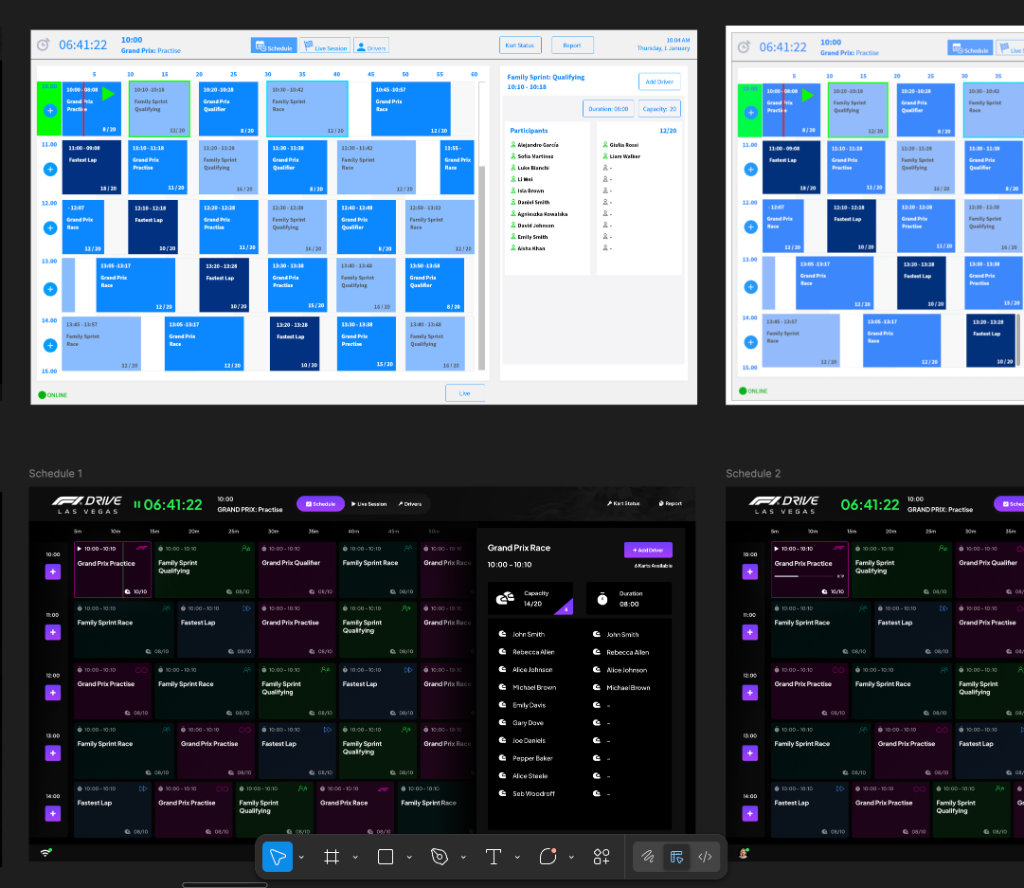
Lo-fidelity wireframes
01 — Session Scheduling
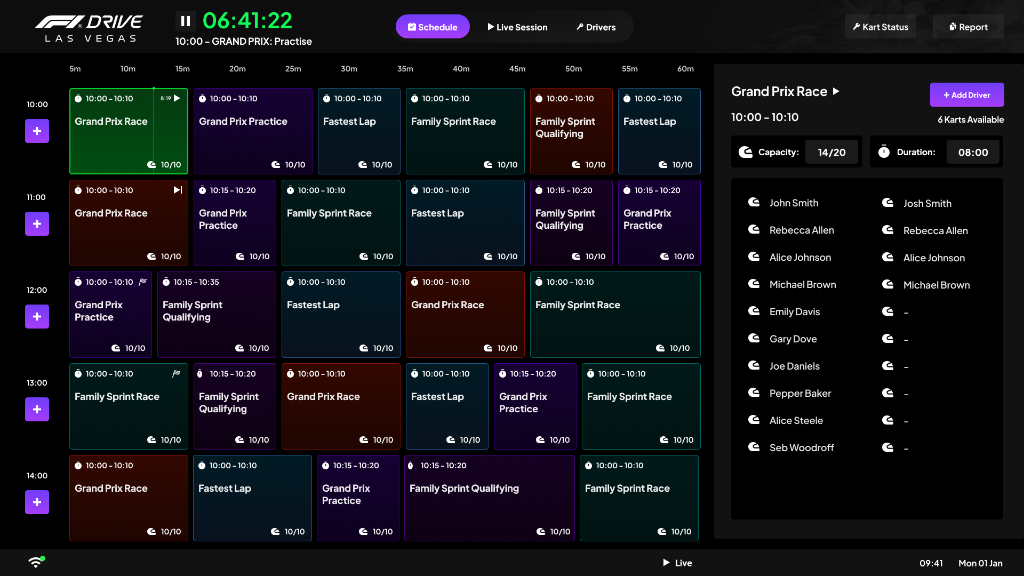
Session scheduling and live operational controls
The scheduling board presents every session across the venue's kart tracks in a dense time-grid view. Staff can see capacity, session type, and kart availability at a glance — and drill into any block for full driver rosters and operational controls. When a session goes live, the panel surfaces linked events — connecting a Practice session to its Qualifier — with real-time participant counts and timing.
02 — Live Sessions
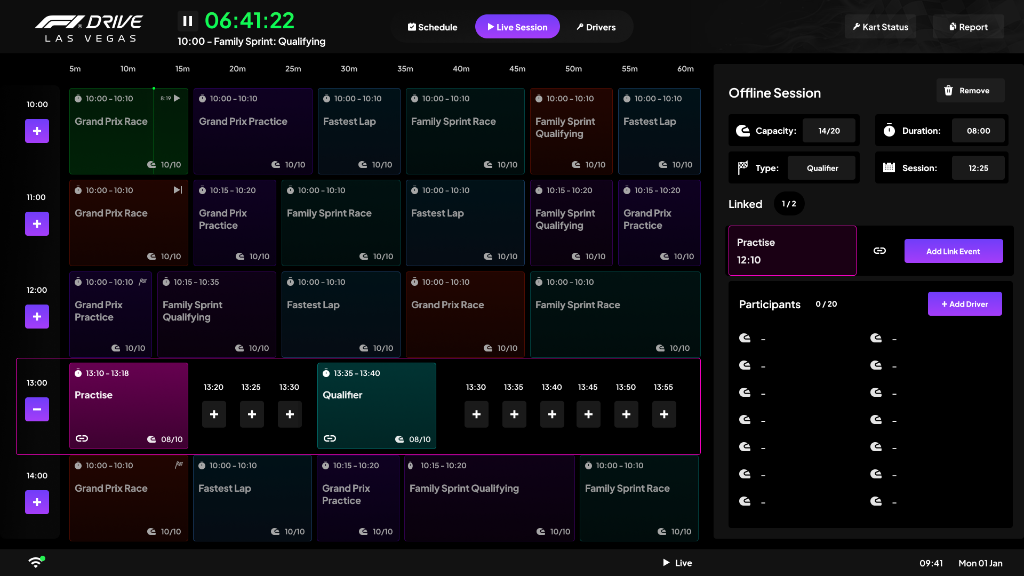
Linked events, live context
When a session goes live, the panel surfaces linked events — connecting a Practice session to its Qualifier — with real-time participant counts and timing.
Linked session chains (Practice → Qualifying → Race)
Real-time capacity tracking (08/10, 14/20)
Offline session management mode
Instant participant add/remove controls
03 — Live Race View
Real-time leaderboards with driver intelligence
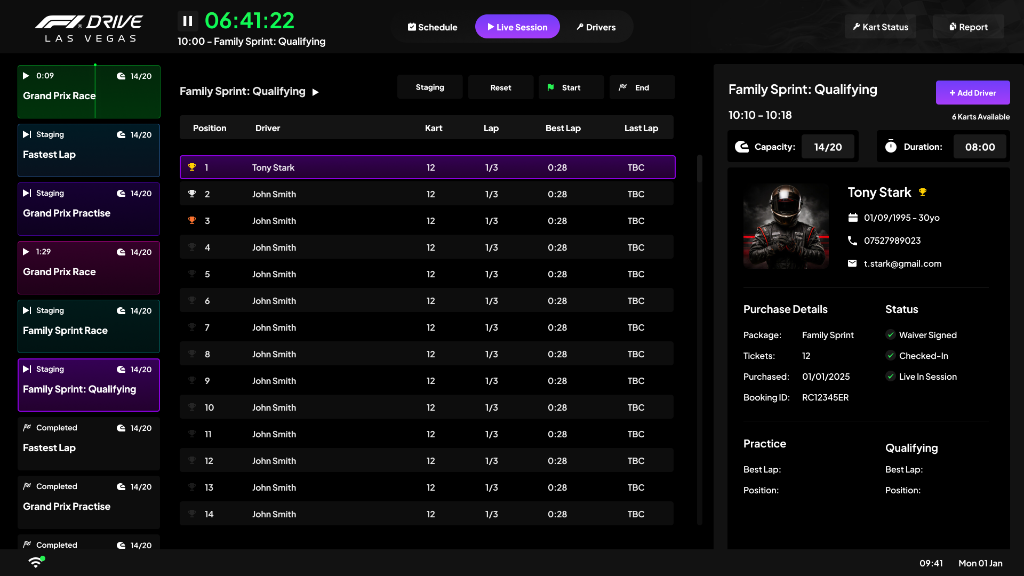
Live standings
Position, kart number, lap count, best lap, and last lap — updated in real time as the race progresses.
Driver profile panel
Clicking any driver reveals their full profile: purchase details, booking ID, check-in status, and session history.
Session state controls
Staging, Reset, Start, and End controls are always visible, giving operators full race control without context switching.
04 — Kart Assignment
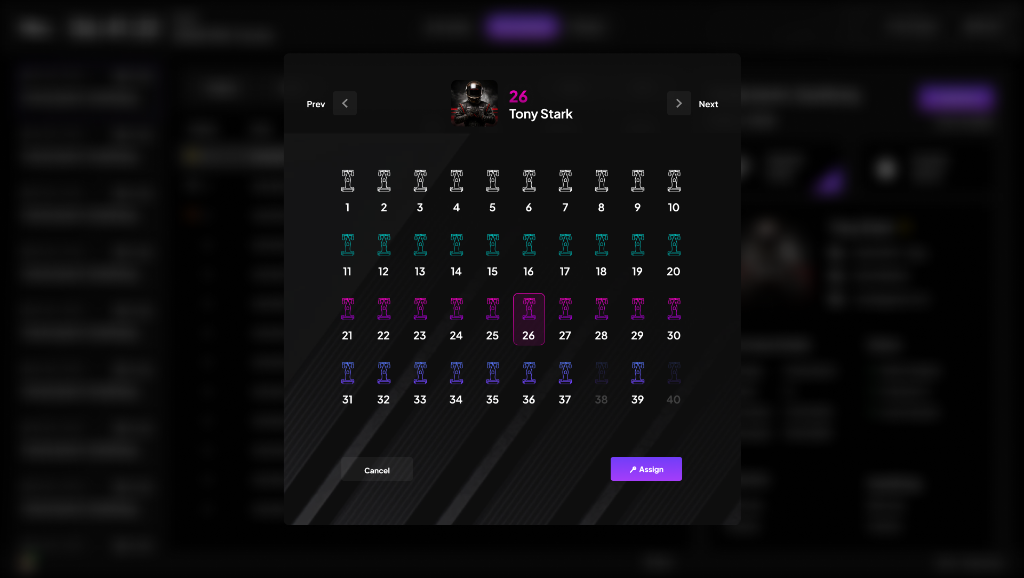
Visual kart selection with live availability
The kart assignment modal displays all 40 karts in a grid, colour-coded by availability status.
05 — Driver Stats
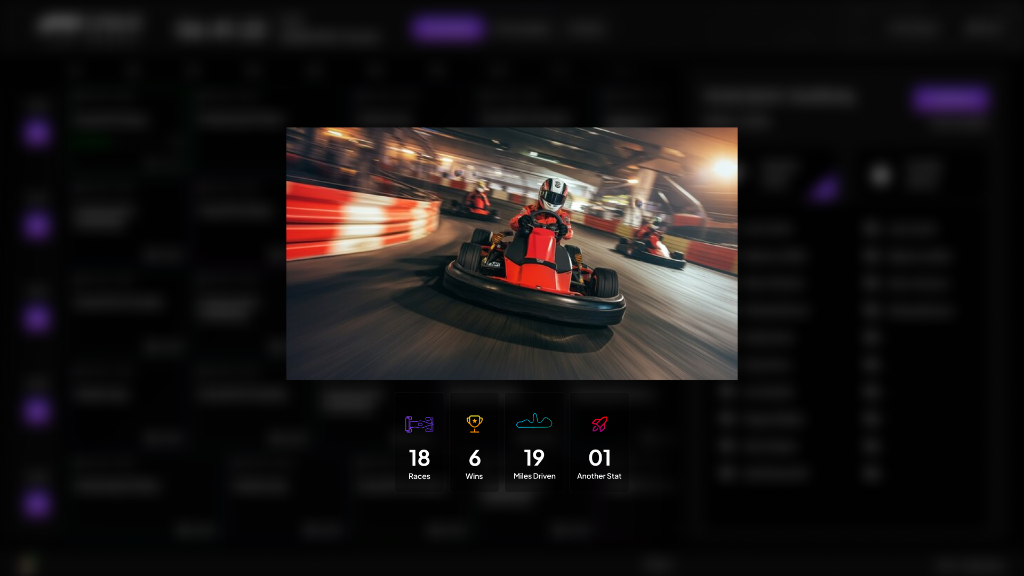
Post-race recap and career stats
After each session, drivers see a full-screen race recap featuring an in-venue video highlight alongside their career stats.
Summary
Overview
A comprehensive venue management platform for Las Vegas kart racing, enabling session scheduling, real-time race tracking, driver management, and post-race analytics.
Challenge
Venue operators needed a centralised system to manage multiple kart sessions simultaneously, track driver performance, and provide spectators with live race insights without manual coordination.
Solution
Built an integrated platform with session scheduling, live lap timing, driver CRM, kart assignment management, race control dashboard, and comprehensive analytics—reducing operational overhead by 60%.
Key Results
06 — User Testing
Venue staff testing — validating speed, clarity, and race-day readiness
Testing was conducted in a simulated venue environment — low lighting, time pressure, and real session data. F1 Drive operators and front-of-house staff were recruited to validate whether the platform could be used under the intense conditions of a live race event without training or a manual.
Race-day simulation sessions
Staff participants were placed in a timed scenario — 'You have 3 minutes to stage 20 drivers, assign karts, and launch the session.' Sessions measured task completion rate, error recovery, and which UI elements caused hesitation under pressure. The kart grid assignment modal and session launch sequence were the two highest-friction areas in round one.
Live leaderboard readability testing
Participants were asked to name the top 3 drivers and identify the gap to the leader from the live leaderboard at a viewing distance of 1.5 metres — simulating a mounted screen environment. This revealed that the monospaced timing columns were too small at the default font size, driving a 20% size increase across all leaderboard data.
First-session onboarding testing
New staff members were given the platform for the first time with no introduction and asked to complete a full session cycle from scheduling through to race end. Sessions captured which features required a tooltip, which were self-explanatory, and where the information architecture needed restructuring for faster task completion.
Key Outcomes
92%
staff efficiency gain — measured against previous manual coordination process
Kart grid
modal required colour-coded availability states — initial greyscale version caused assignment errors under time pressure
Leaderboard
font size increased 20% after readability testing at 1.5m viewing distance
"Race Control"
bar relabelled from 'Session Controls' after staff couldn't identify it quickly without context
4.8★
operator satisfaction — tested across 3 venue staff cohorts before final design sign-off
Methodology
Design System
A cohesive visual language built for speed and clarity
Every decision — from typography scale to component states — was optimised for a dark, fast-paced venue environment where staff need instant visual clarity.
Colour Palette
Race Red
#E8003D
Primary CTAs, live state indicators, danger alerts
Carbon Dark
#0A0A0F
Primary background surface across all screens
Surface 01
#141418
Card backgrounds, modals, panels
Surface 02
#1E1E26
Elevated components, dropdown backgrounds
Neon Amber
#FFA500
Session warnings, caution states, lap delta alerts
Signal Green
#00E676
Active sessions, top position indicators, success states
Text Primary
#F5F5F5
Headings, key data labels, leaderboard names
Text Secondary
#8A8A9A
Meta labels, secondary stats, timestamps
Typography Scale
72px / 800w
Display / Race Number
Kart numbers, position rank on live race view
32px / 700w
Heading 1
Session titles, screen headings
22px / 600w
Heading 2
Panel headers, driver names
14px / 400w
Body
Lap times, booking details, descriptions
11px / 500w
Label / Eyebrow
Uppercase status tags, category labels, column headers
13px / 500w
Mono Data
Lap timers, live counters — tabular mono for alignment
Core Components
Session Card
Dense time-grid block showing session type, capacity badge, and status pill. Colour-coded border-left indicates live / upcoming / completed state.
Live Leaderboard Row
Full-width row with rank, kart number, driver name, lap count, best lap and gap — monospaced timing columns ensure perfect data alignment at speed.
Status Pill
Compact rounded tag in red (live), amber (staging), green (completed) or grey (scheduled). Used consistently across sessions, karts and driver states.
Kart Grid Cell
Square icon-cell from the 40-kart selection grid. Available = dim outline, Assigned = filled with race number, Unavailable = crossed overlay.
Stat Card
Small metric tile used in the operator dashboard — bold number above a muted label, with a micro trend indicator arrow.
Race Control Bar
Sticky footer-anchored control strip with Staging / Reset / Start / End actions. Always visible during a live session — never hidden behind scroll.
"Chris built a comprehensive platform that transformed how we manage venue operations. The real-time session scheduling, live race tracking, and driver analytics reduced our operational overhead by 60% while dramatically improving staff efficiency."
Marcus Chen
Operations Manager, F1 Drive Las Vegas