Ad Platform App
AC
Advertising Cloud — End-to-End Ad Management Platform
Overview
A professional ad management platform enabling agencies and brands to create, manage, and analyse advertising campaigns across every major platform.
AC (Advertising Cloud) is a full-stack creative and campaign operations tool built for advertising agencies working with major brands. The platform covers brand and client management, creative asset libraries, AI-labelled asset ingestion, multi-platform ad distribution (Meta, TikTok, Google, Amazon, LinkedIn and more), strategic brief workflows, and deep analytics — all within a dark, high-density interface designed for power users.
Role
Lead UX/UI Designer
Platform
Desktop Web App
Duration
9 months
Tools
Figma, FigJam, Maze, Lottie
Team
PM, 3 Engineers, UX Researcher, Designer, BA
13+
Ad Platforms Integrated
32
Pages of Brand Data
60%
Faster Campaign Setup
5★
Internal NPS Score
01 — Onboarding
A clean, guided entry point to AC
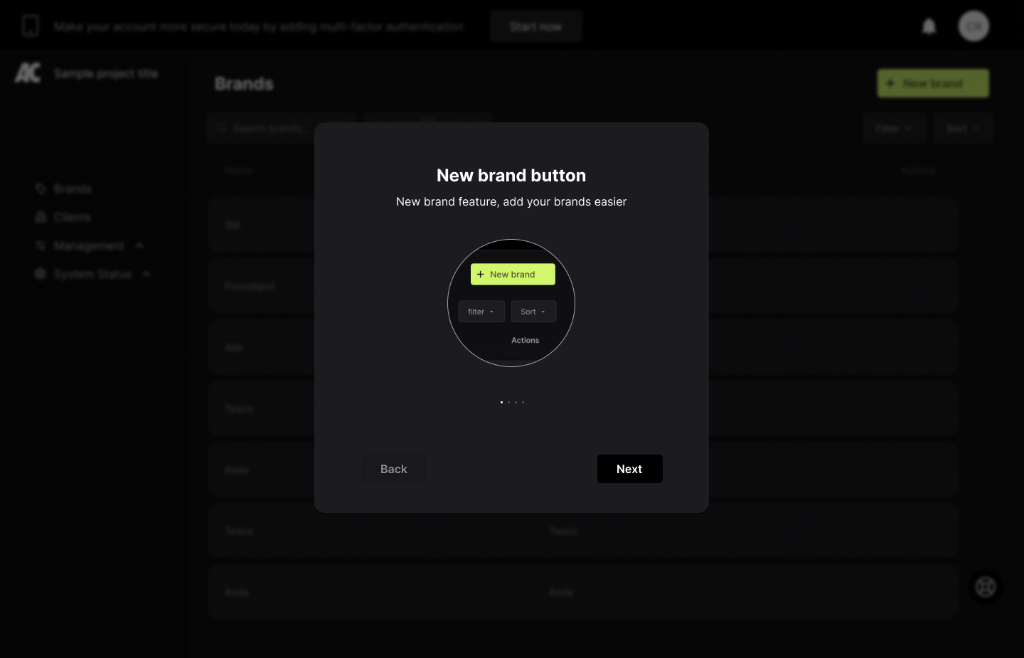
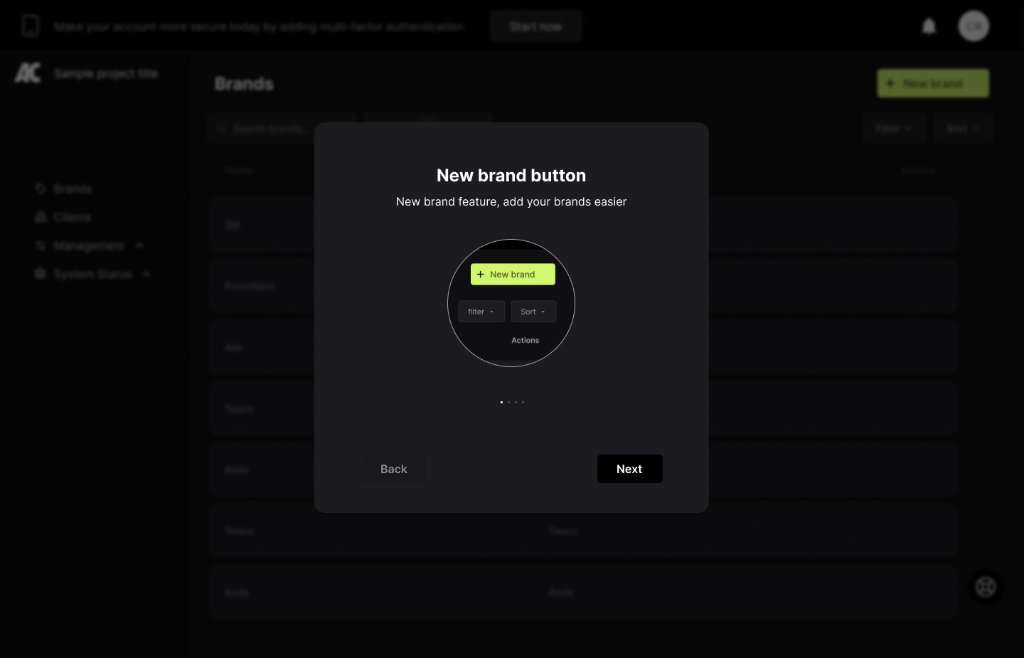
First-time users are walked through the platform's core capabilities via a contextual onboarding overlay system. Each modal spotlights a specific feature — such as the New Brand workflow — using a magnified callout and step indicator, keeping users oriented without leaving the live interface.
Step-by-step feature tours without leaving the app
Contextual callouts highlight exact UI elements
Progress indicators across multi-step walkthroughs
Dismissable at any point — returns to last position
02 — Brand Management
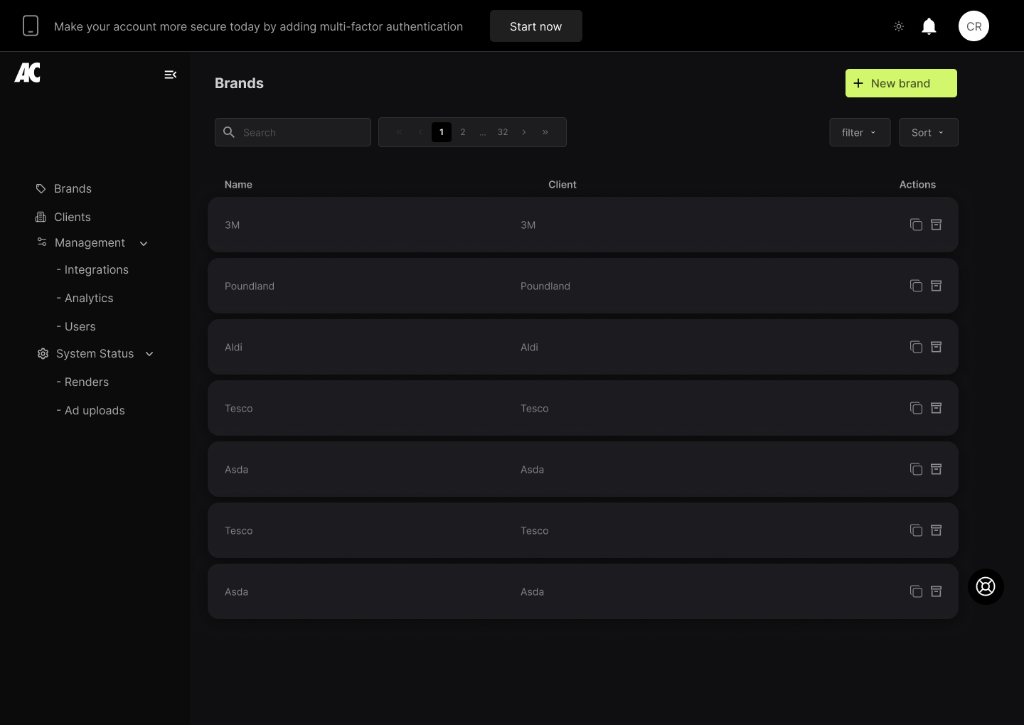
Every client and brand, paginated and searchable
The Brands module is the central hub for agency operations, with paginated navigation across 32+ pages of entries.
03 — Analytics
Deep campaign performance, broken down every way
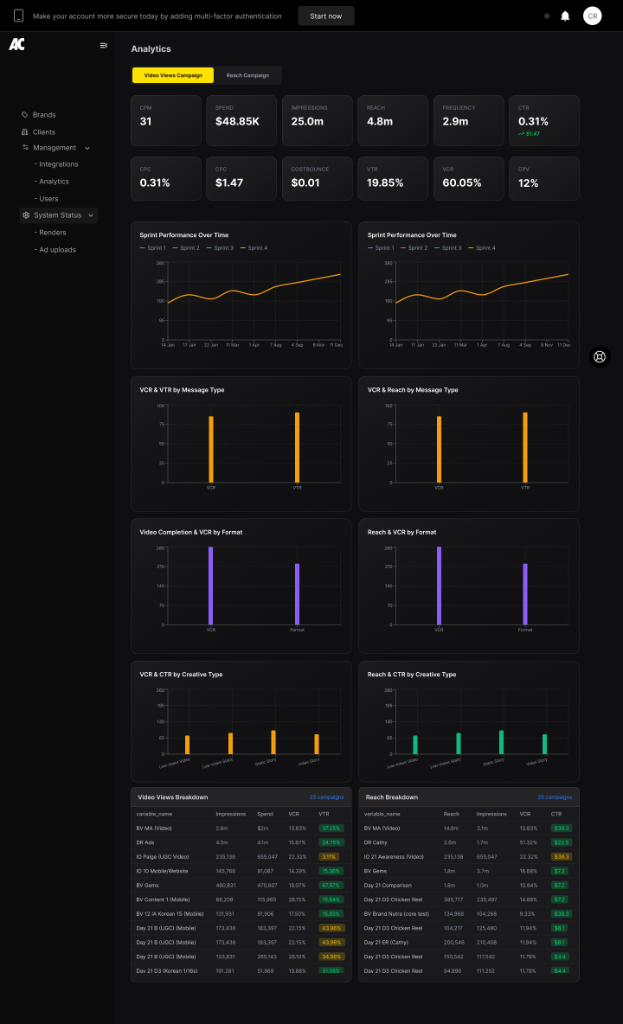
KPI header bar
CPM, Spend, Impressions, Reach, Frequency, CTR, CPC, CPV, Cost/View, VTR, VCR, and CPV presented as scannable metric cards at the top of every campaign view.
Sprint performance charts
Line and bar charts compare Sprint 1–4 performance over time, with VCR & CTR broken down by message type, format, and creative type across dual-panel layouts.
Breakdown tables
Video Views and Reach breakdown tables list every creative with Impressions, Spend, VCR, and VTR — colour-coded cells flag underperformers and top performers instantly.
04 — Asset Library
A structured creative library for every brand
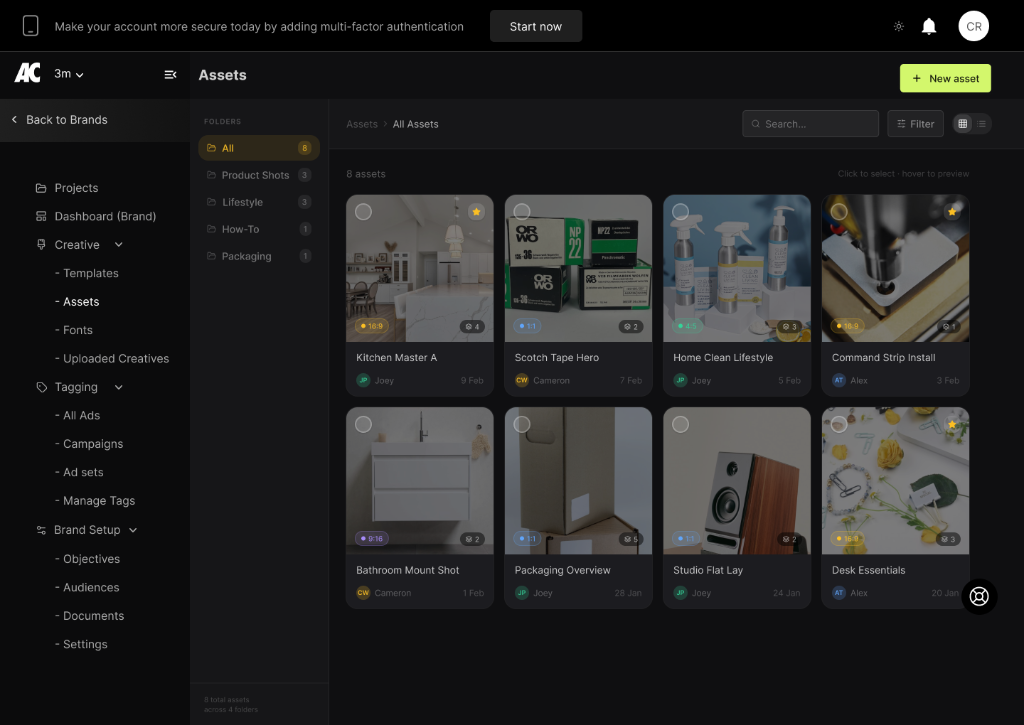
Each brand has a dedicated Assets section with folder-based organisation and thumbnail previews.
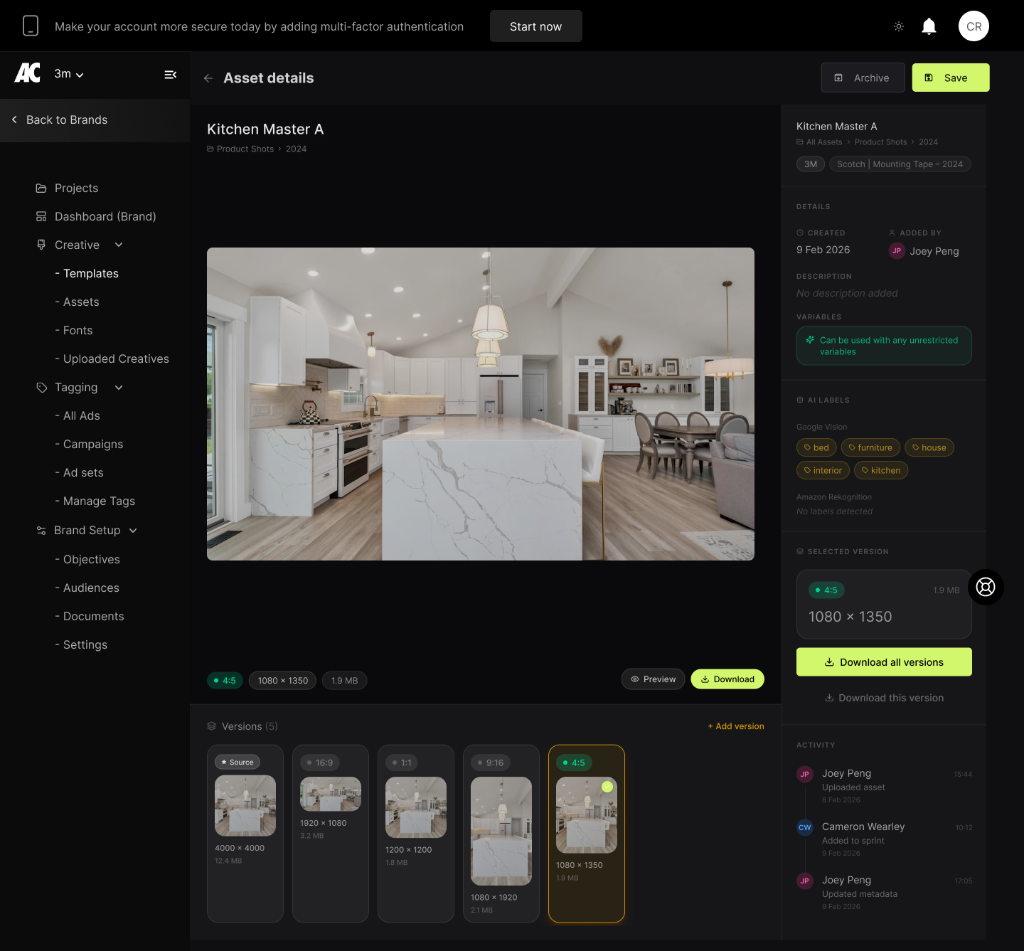
Asset detail panel
Full metadata view shows AI labels (Google Vision + Amazon Rekognition), multi-ratio version previews (Source, 16:9, 1:1, 9:16, 4:5), activity log, and one-click download of all versions or individual formats.
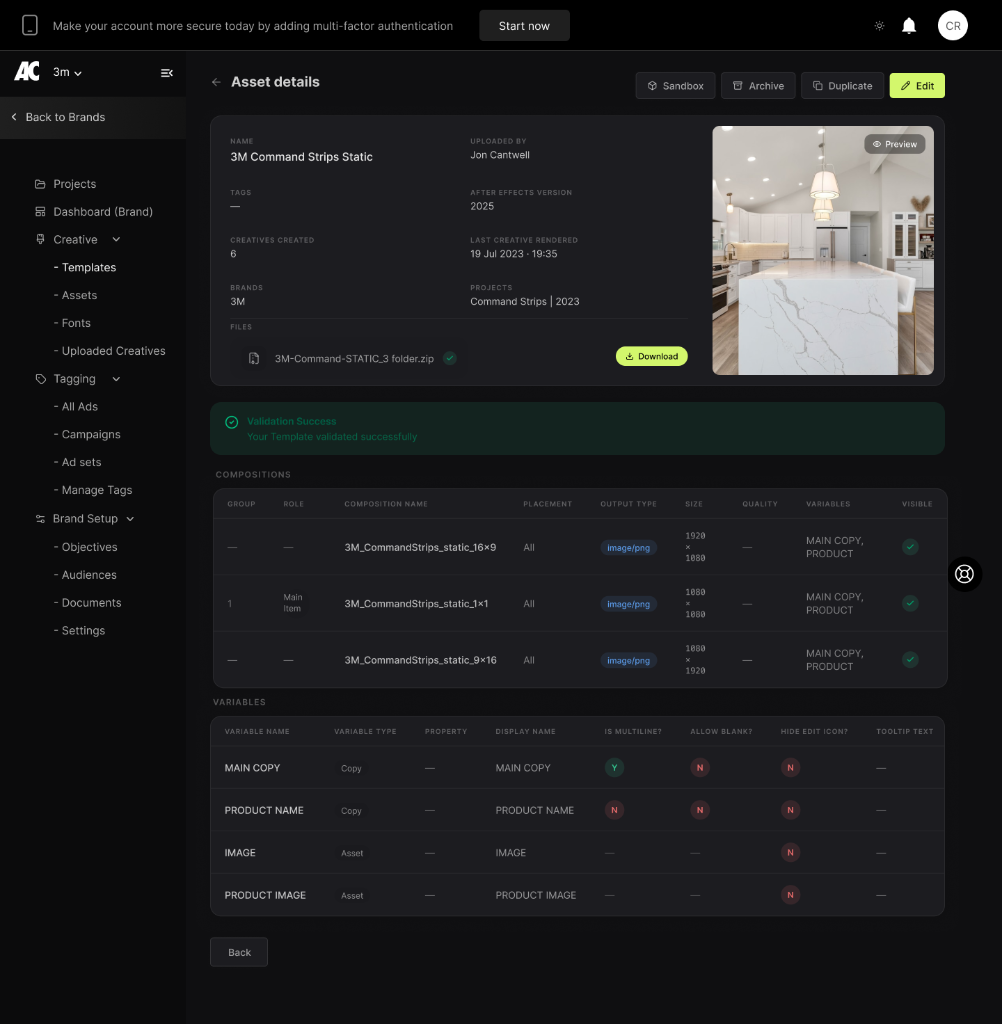
Template compositions
After Effects template details list every composition with group, role, placement, output type, size, and variables. A validation system confirms templates are production-ready before creative render.
05 — Strategic Brief
A guided 6-step workflow from brief to submission
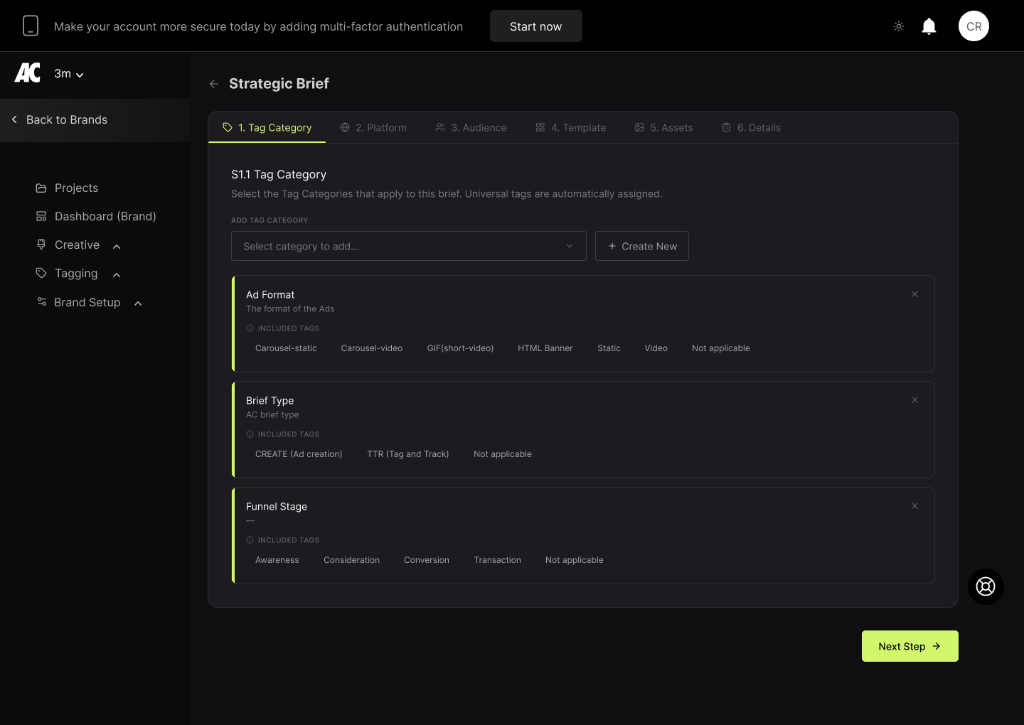
Step 1
Tag Category
Select Ad Format (Carousel, Video, HTML Banner…), Brief Type (CREATE / TTR), and Funnel Stage (Awareness → Transaction). Categories are colour-coded with expandable tag sets.
Step 2–5
Platform, Audience, Template & Assets
Guided steps collect platform selection, audience targeting (age, interest), creative template, and asset uploads — each with sensible defaults and inline validation.
Step 6
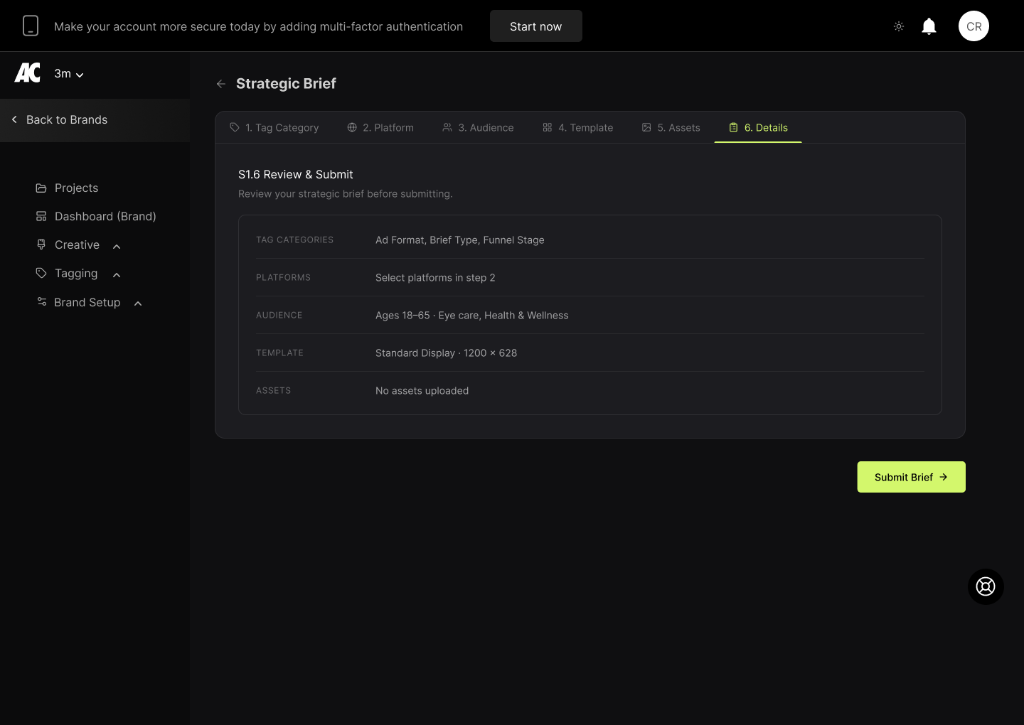
Review & Submit
A clean summary view confirms all brief parameters before submission — Tag Categories, Platforms, Audience, Template, and Assets — with a single prominent Submit Brief CTA.
06 — Platform Integrations
Connect to every major ad platform in one click
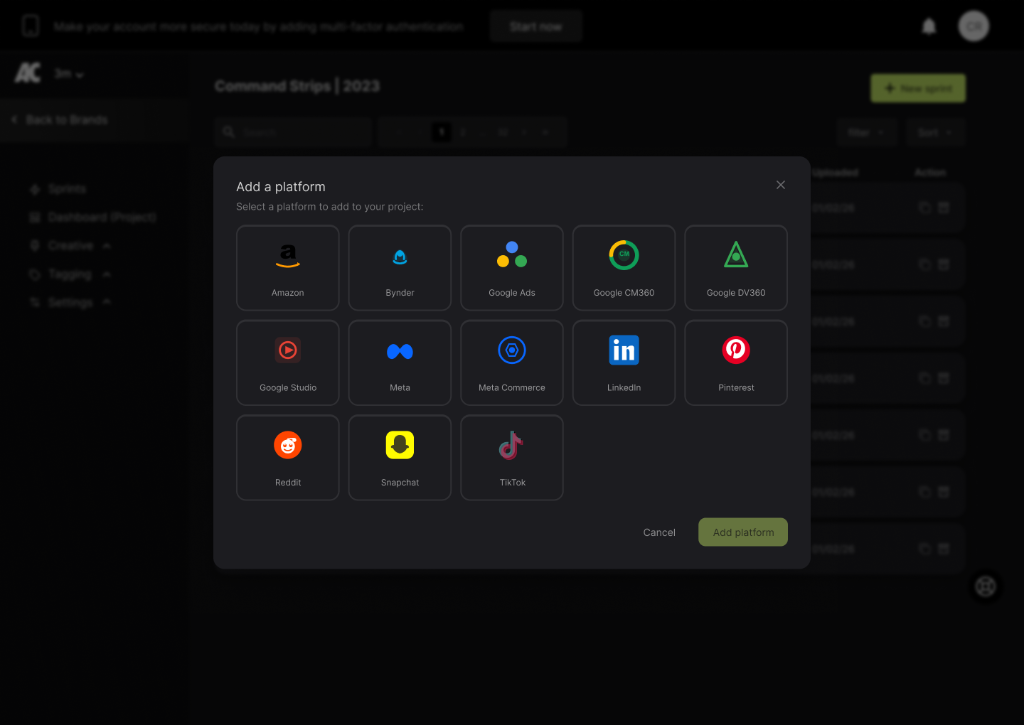
The Add a Platform modal surfaces all 13 supported ad platforms as a branded icon grid.
Projects are configured once and campaigns are distributed to all selected platforms without leaving the AC interface.
Summary
Overview
A professional ad management platform enabling agencies and brands to create, manage, and analyse advertising campaigns across 13+ major ad platforms.
Challenge
Advertising agencies managed campaigns across fragmented platforms, requiring teams to context-switch between dashboards, limiting data visibility and campaign performance analysis.
Solution
Built an integrated creative hub and campaign operations platform with multi-platform distribution, asset library with AI-labelling, strategic brief workflows, and unified analytics—reducing setup time by 60%.
Key Results
07 — User Testing
Power user validation — agency teams stress-testing the full workflow
Testing focused on real advertising agency workflows — briefs under deadline pressure, multi-brand asset searches, and campaign analytics reviews. Sessions recruited experienced media buyers and creative ops managers to validate the dense, high-frequency interactions across the platform.
Maze unmoderated testing
Task-based flows were deployed via Maze to agency participants globally — measuring click paths, time-on-task, and misclick rates across the brief workflow (Tag → Platform → Audience → Template → Assets → Review) without a facilitator present.
Think-aloud creative review sessions
Moderated sessions asked participants to review analytics dashboards and asset libraries while narrating their experience. Sessions revealed specific friction points around KPI card labelling (CPV vs CPC confusion) and the asset thumbnail hover state for download actions.
Workflow timing benchmarks
Participants were timed from brief creation to submission across A/B variants of the 6-step flow. Timing data directly informed which step labels, default states, and validation patterns reduced overall completion time — validated against the target of under 8 minutes end-to-end.
Key Outcomes
60%
faster campaign setup vs legacy tools — validated through timed workflow benchmarking
Step 1
Tag Category was the highest-friction step — relabelling reduced error rate from 34% to 6%
5★
internal NPS following onboarding overlay redesign based on first-session observation findings
Analytics
KPI bar required 3 rounds of labelling iteration — CPV vs CPM confusion resolved with tooltip expansion
"Brief B"
step ordering (Assets before Template) outperformed the original — adopted for production build
Methodology
Design System
A high-density visual language built for power users
Every component — from analytics cards to brief workflows — was designed for speed and clarity across a dark, data-heavy interface used daily by agency teams.
Colour Palette
AC Indigo
#4F46E5
Primary CTAs, active nav, selected states, brief step progress
Surface Dark
#0F0F17
Primary background across all app screens
Surface 01
#1A1A2E
Card surfaces, modals, sidebar panels
Surface 02
#252540
Elevated components, dropdowns, hover states
Signal Green
#10B981
Success states, active integrations, included features
Amber Alert
#F59E0B
Warnings, pending campaign states, budget alerts
Text Primary
#F1F5F9
Headings, metric values, brand names
Text Secondary
#94A3B8
Labels, descriptions, timestamps, meta info
Typography Scale
40px / 700w
Display / Brand Name
Brand and client name headings on overview pages
28px / 600w
Heading 1
Section titles, analytics page headings
20px / 600w
Heading 2
Card headers, module names, brief step titles
14px / 400w
Body
Descriptions, asset metadata, brief content
11px / 500w
Label / Eyebrow
Uppercase column headers, status tags, filter labels
24px / 700w
Metric Value
KPI numbers — CPM, Spend, CTR — dominant data anchors
Core Components
KPI Metric Card
Compact stat tile displaying a headline figure (CPM, CTR, Spend) with a muted label and micro trend arrow. Arranged horizontally across the top of every analytics view.
Brand Row
Paginated list item showing brand logo, name, client count, and status badge. Supports bulk selection and inline actions without leaving the list.
Asset Thumbnail
Grid card with ratio-aware preview, AI label chips (Google Vision / Rekognition), format badges (16:9, 1:1, 9:16), and a hover action bar for download and detail.
Platform Icon Grid
Branded icon tiles for all 13 ad platforms — Meta, TikTok, Google, Amazon, LinkedIn and more. Toggle-select with active ring highlight and disabled state for unauthorised connections.
Brief Step Indicator
Horizontal 6-step progress bar with labelled stages (Tag, Platform, Audience, Template, Assets, Review). Active step is highlighted; completed steps show a check with back-navigation.
Onboarding Callout
Contextual overlay tooltip pinned to a specific UI element with a step counter, descriptive body, and Next/Skip controls — used to spotlight features without navigating away.
"The unified campaign management platform Chris designed has been transformative. Multi-platform distribution, AI-powered asset libraries, and integrated analytics cut our campaign setup time in half. It's become our team's central hub for creative operations."
Sarah Whitmore
Creative Director, Advertising Cloud